The buyer isn't a car enthusiast.
Nissan Commercial didn't need a slicker interface. They needed a tool that helped a busy contractor or fleet buyer make a working decision in the short window they had between jobs. I led research strategy on the NCV Visualizer.
The brief I gave myself was one line. Every interaction had to come from something we'd actually watched a buyer do.
Building on an existing mobile foundation.
Before the Visualizer, Nissan Commercial Vehicles already had a mobile site covering the basics: build a vehicle, locate a dealer, search inventory, and request a quote, all from a phone. It let buyers browse the NV lineup, flip through exterior and interior image galleries, and get a starting point on pricing without sitting down at a desk.
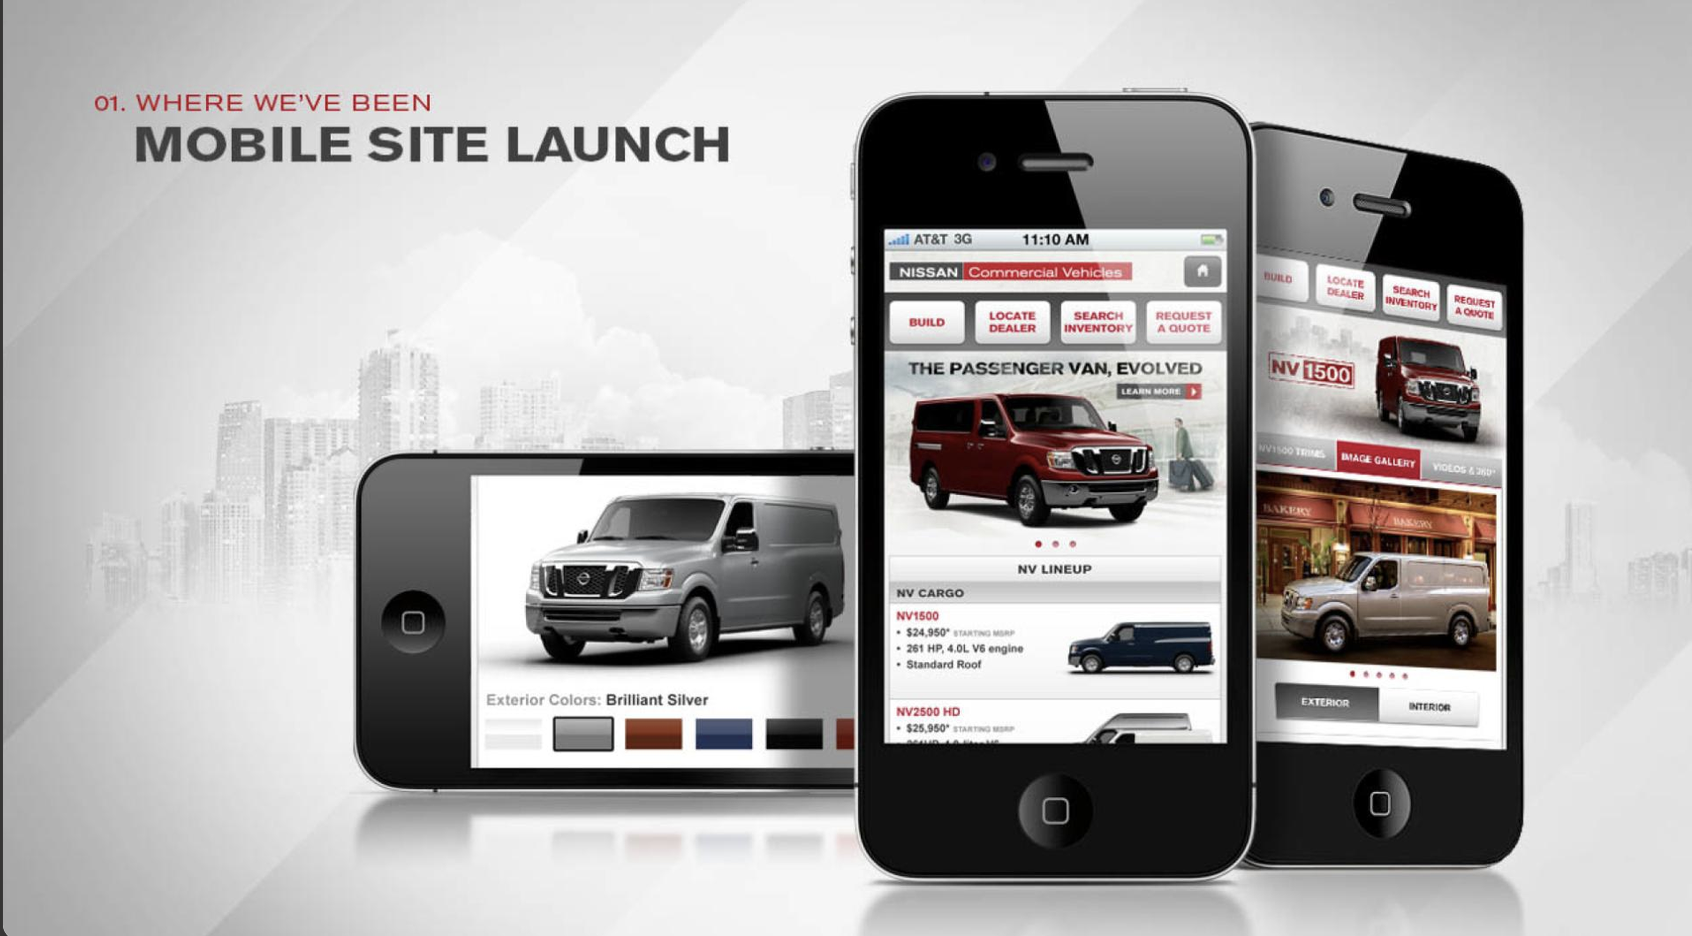
That foundation covered browsing and lead generation well, but it stopped short of letting a buyer actually configure a van on their phone. A mobile visitor could look, not build, and that gap was part of the case for the richer Visualizer experience described below, as well as why a mobile-first configurator is still on the roadmap.
Research lead and team lead.
- Ran research from discovery through post-launch
- Field studies at dealerships and trade shows, watching buyers in context
- Usability sessions with small business owners and commercial fleet buyers
- Translated findings into personas, journey maps, and co-designed concepts
- Partnered with Nissan stakeholders, engineers, and dealer specialists on strategy and execution
Going to where the work happens.
I started with stakeholder interviews on Nissan's Fleet & Commercial team, then got out of the building. Dealerships. NTEA. Anywhere buyers actually showed up. A focus group wouldn't have told me half of what I saw in those rooms. Buyers were scribbling on the back of spec sheets, walking into dealerships with printouts, and hashing out payload numbers with their partners on the spot.
The personas came straight out of patterns I kept seeing across fleet managers, contractors, and the sales reps standing next to them.
These buyers care about reliability, whether the upfit will actually fit, and what the whole thing costs them. They want that clearly, and they want it fast. Anything in the way of that is in the way of the sale.
Designing the flow with the people who use it.
Card sorts told me which specs and features mattered most, broken out by trade. Then I ran co-design sessions with dealer specialists and journey-mapped with the Nissan team to lock down the flow from first look to quote request.
A printable, shareable config beat any slick animation. Buyers wanted something on paper they could point at across a dealer's desk, or hand to their boss back at the shop.
Built to bridge the screen and the lot.
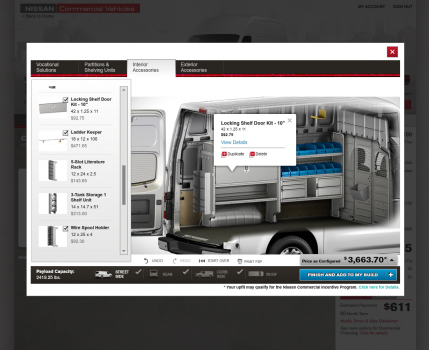
The Van Visualizer is integrated with dealerships and the upfitting and graphics vendors, so that users can not only design their van, but drive it off the lot with the customized features in place.
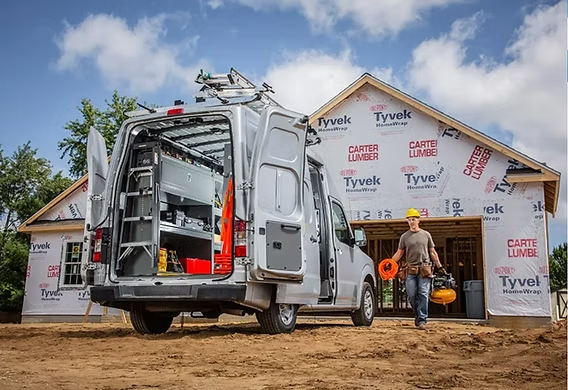
That integration changed what the tool was. Instead of stopping at a saved PDF, the configuration carries through to the dealer, the upfitter, and the graphics vendor, so the truck a buyer designed on the screen is the truck waiting for them on the lot. No re-spec, no second build, no gap between intent and pickup.
Usability testing in five U.S. markets.
I ran three rounds of moderated in-person testing across five U.S. markets, recruiting contractors, fleet managers, and upfitters rather than general consumers. The sessions were built around task scenarios drawn directly from things we'd watched buyers do in the field: configure a van for a plumbing trade, get to a printable spec sheet, share the build with a business partner. Each round targeted a different fidelity: low-fi to stress-test the configuration flow and option hierarchy, mid-fi to run an A/B comparison of list view versus card grid for spec browsing, and a near-final build before launch to validate the full configure-price-print path.
The most consequential finding came mid-testing. Buyers liked the visual and the real-time pricing, but the option count was burying them. A contractor just wanted a sensible starting point for a plumbing rig, not a blank van and 200 accessories. That led directly to trade-specific templates: pre-configured setups by trade type that buyers could adjust rather than build from scratch. It cut time-to-configure significantly and removed the paralysis that was showing up in session after session.
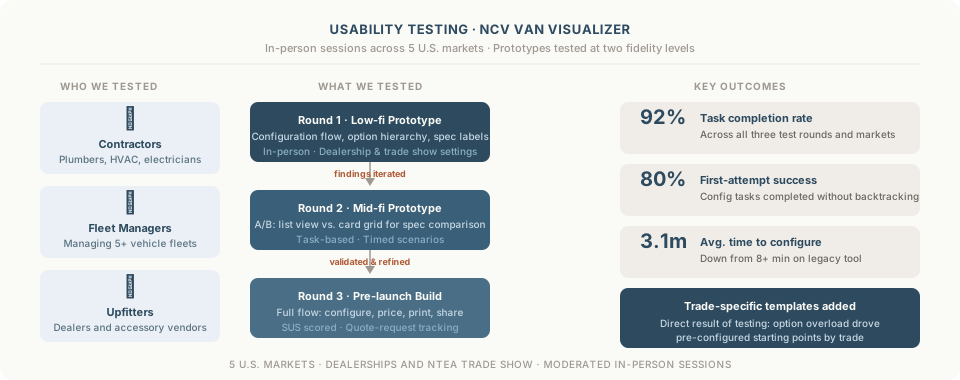
10 participants per round · 30 total across three rounds
People liked playing with the visual, but the sheer option count buried them. I pushed for trade-specific templates so a plumber or HVAC tech started from a sensible setup instead of a blank van.
"I don't need a million options. I just want the best setup for plumbing jobs."
"I love that I can print this and take it to my boss. It's exactly what he wants."
Listening after launch.
I watched the drop-off points, fired survey intercepts after moments that mattered (save, print, share), and kept a back-channel open with dealer reps so ground truth from the floor kept coming back to the team.
Buyers who finished the visualizer were 2.3× more likely to request a quote. That was the number that told us the tool was earning its keep in the funnel, not just looking good in a screenshot.
Numbers the business cared about.
"Customers are coming in better prepared and more decisive." Dealer feedback
Buyers who built and printed a config closed at meaningfully higher rates once they walked onto the dealer lot. The paper in their hand was doing real work.
From the screen to the job.
The Visualizer's job ended when the keys changed hands, but the work the buyer was actually planning for happened after that. The shots below ran across the campaign and dealer materials we built alongside the tool, anchoring the configurator back to the trades it was made for.
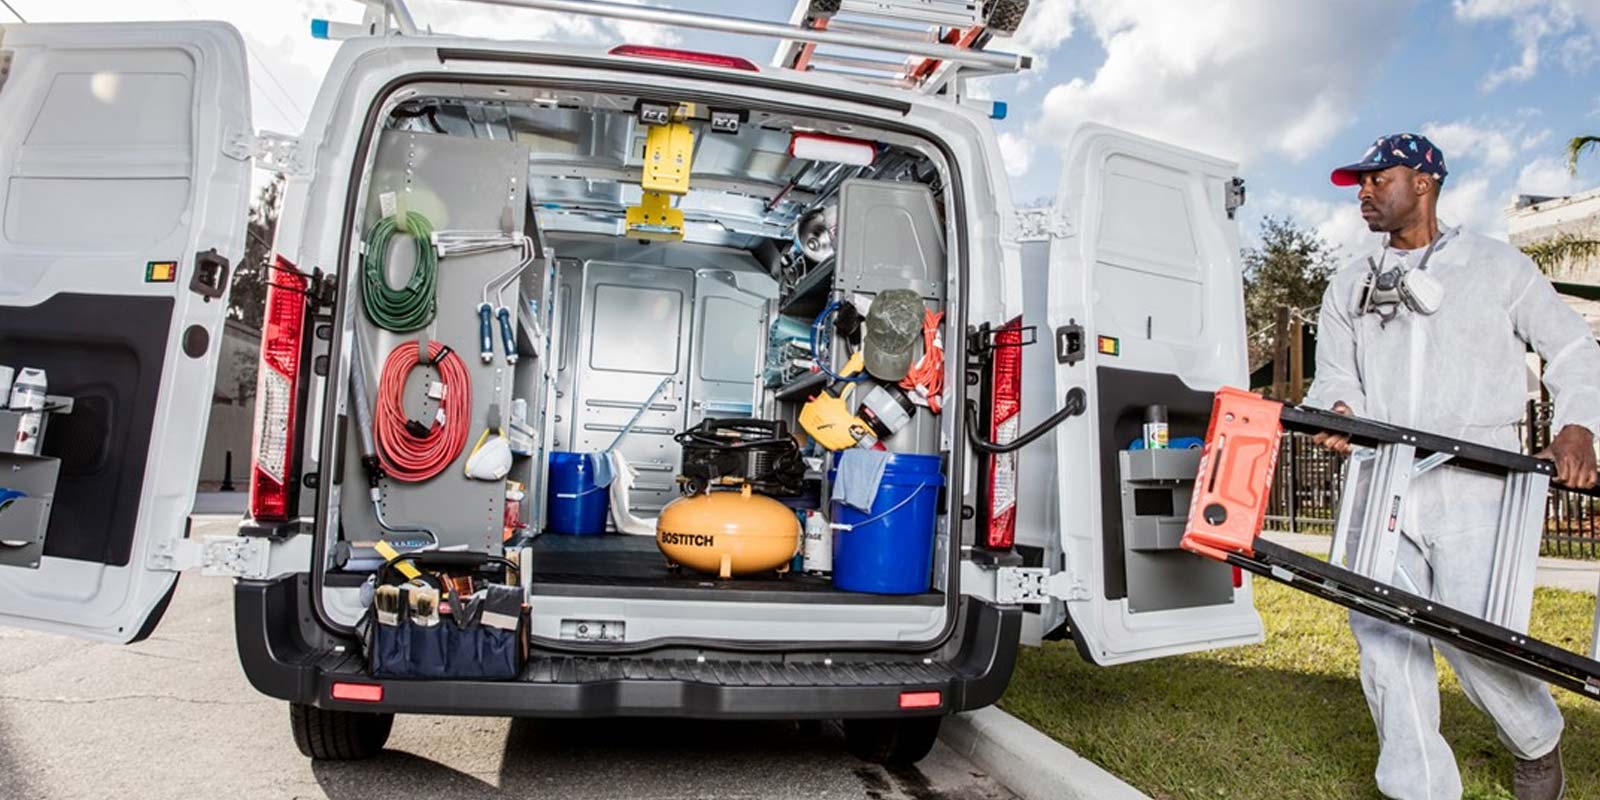
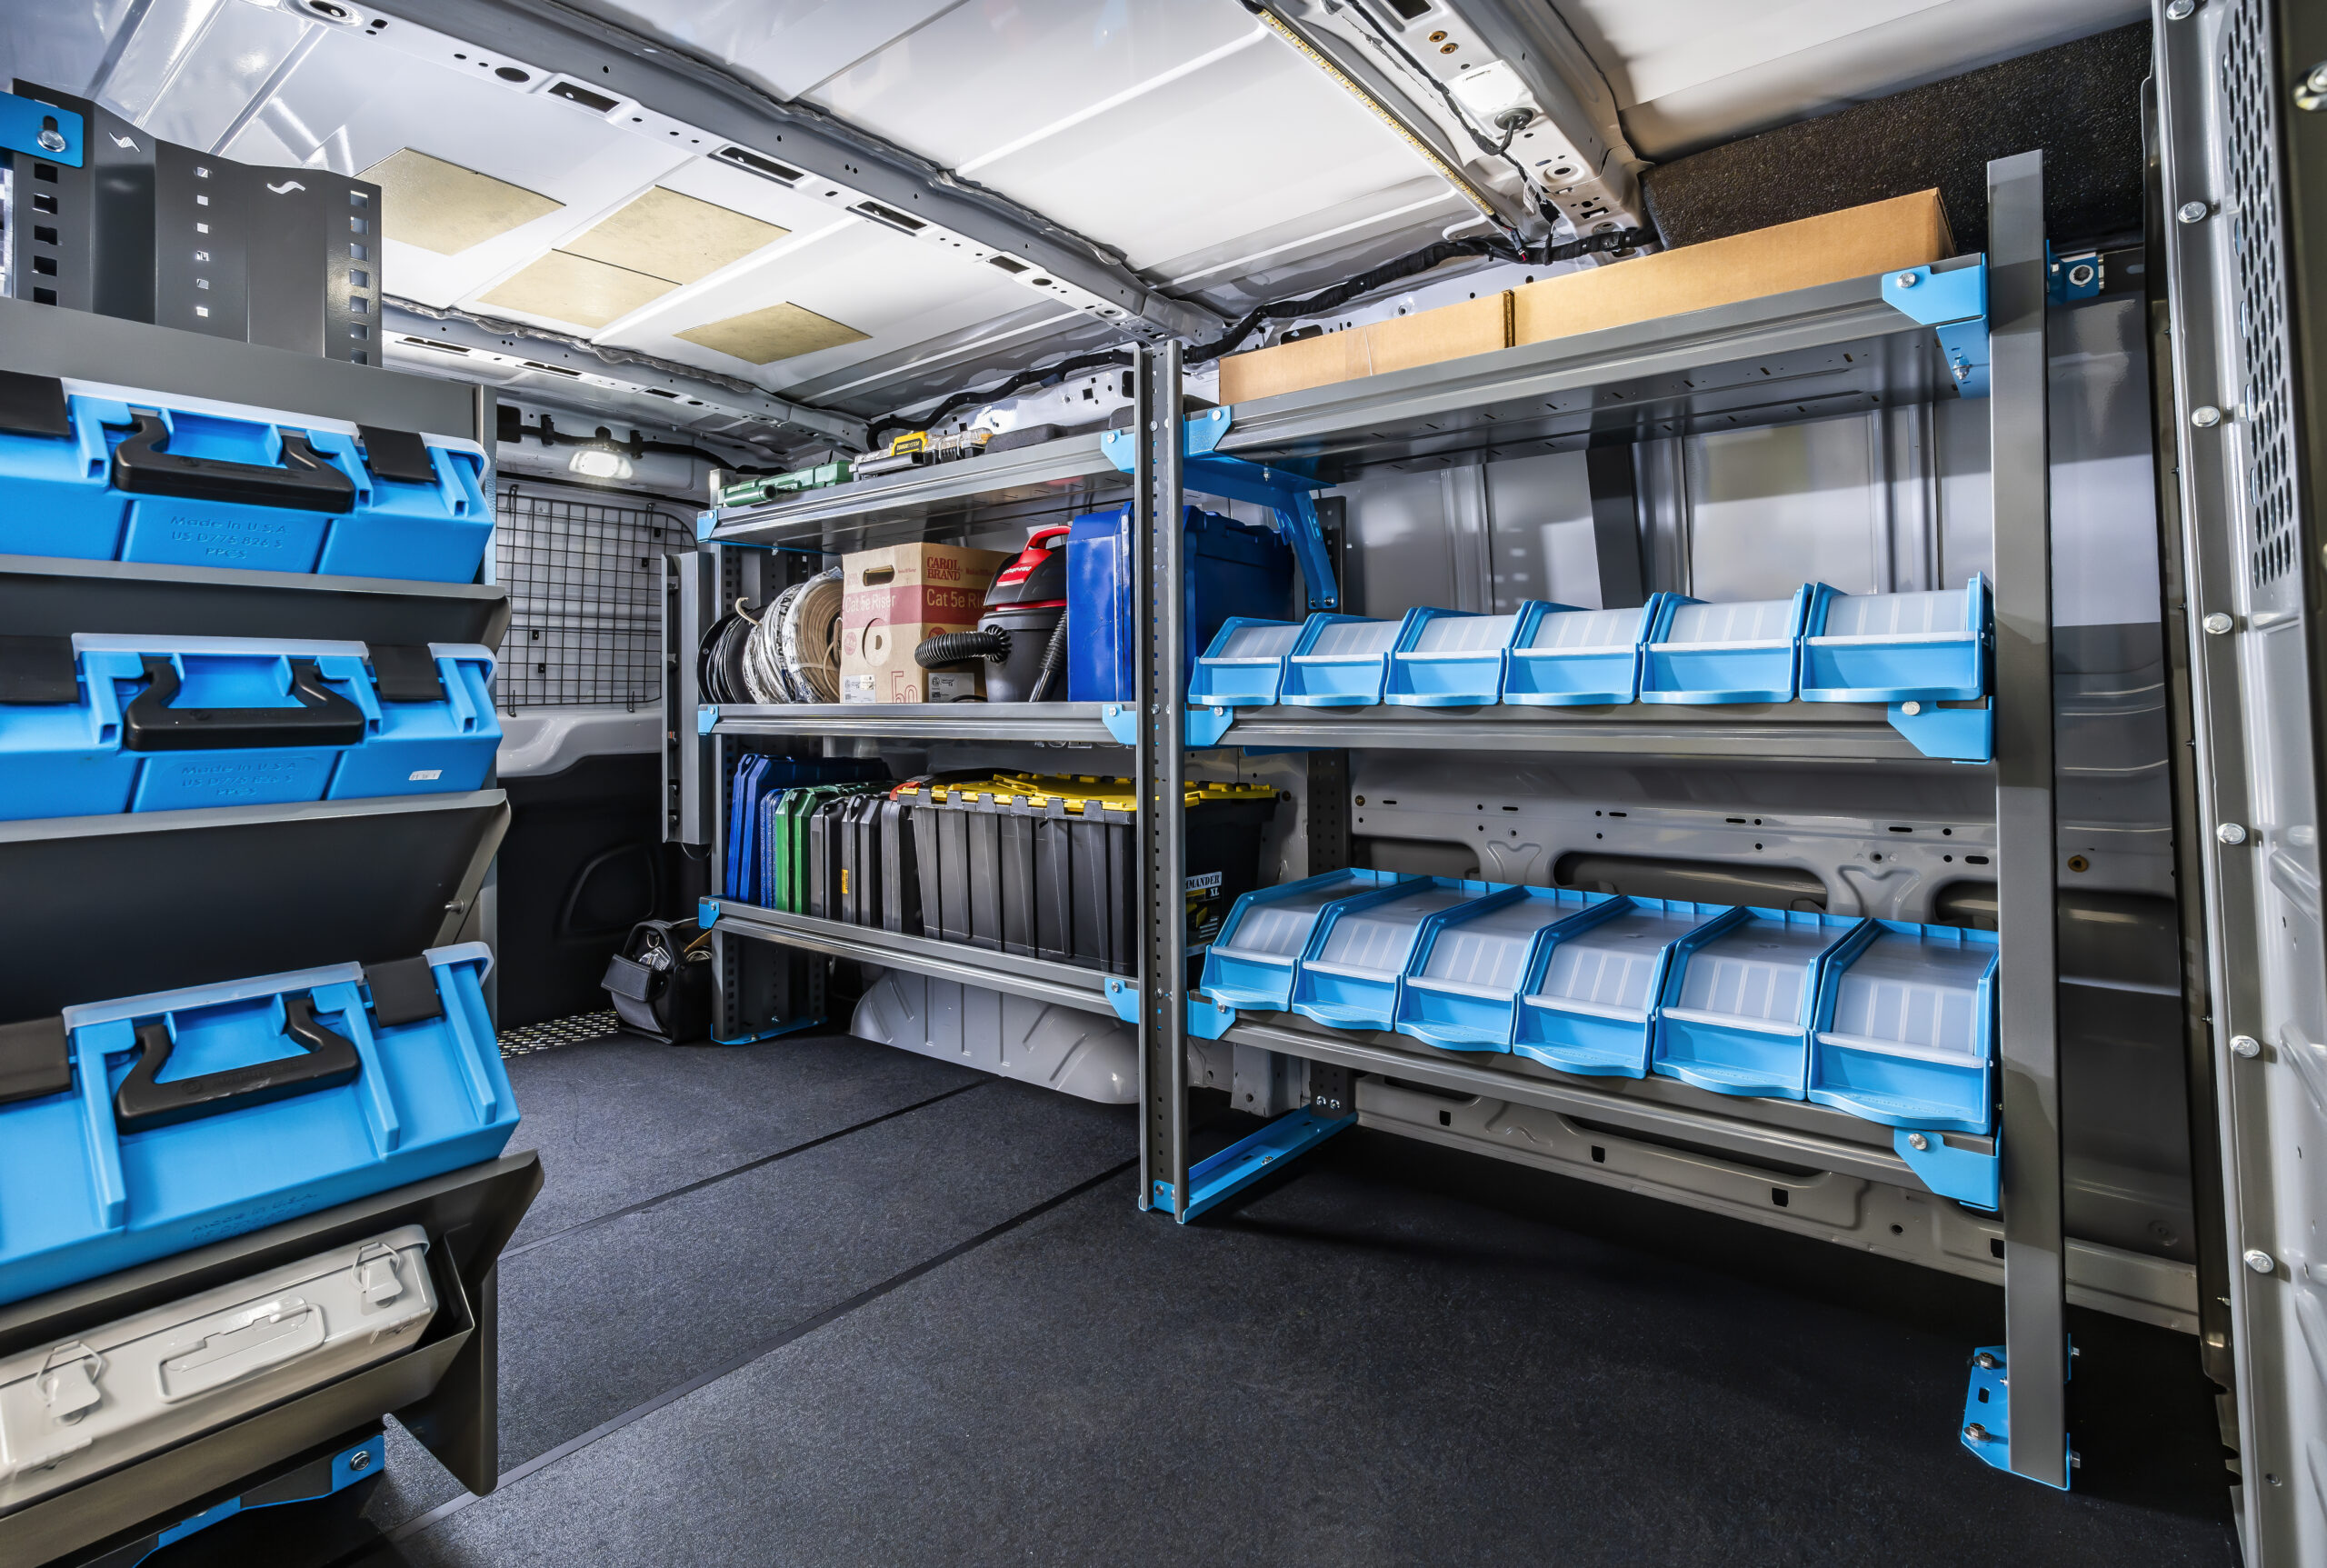
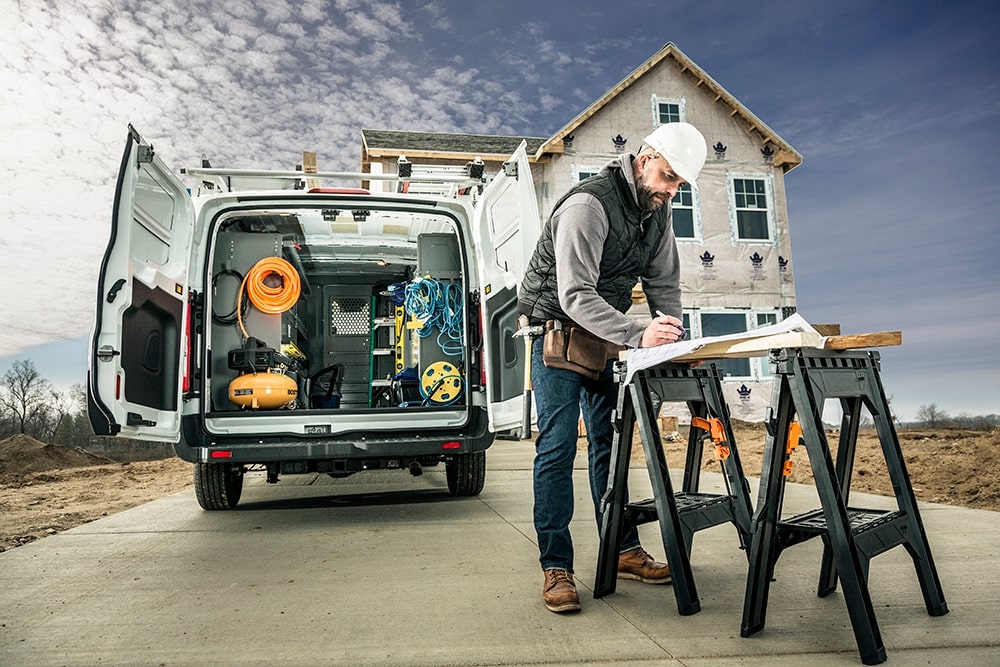
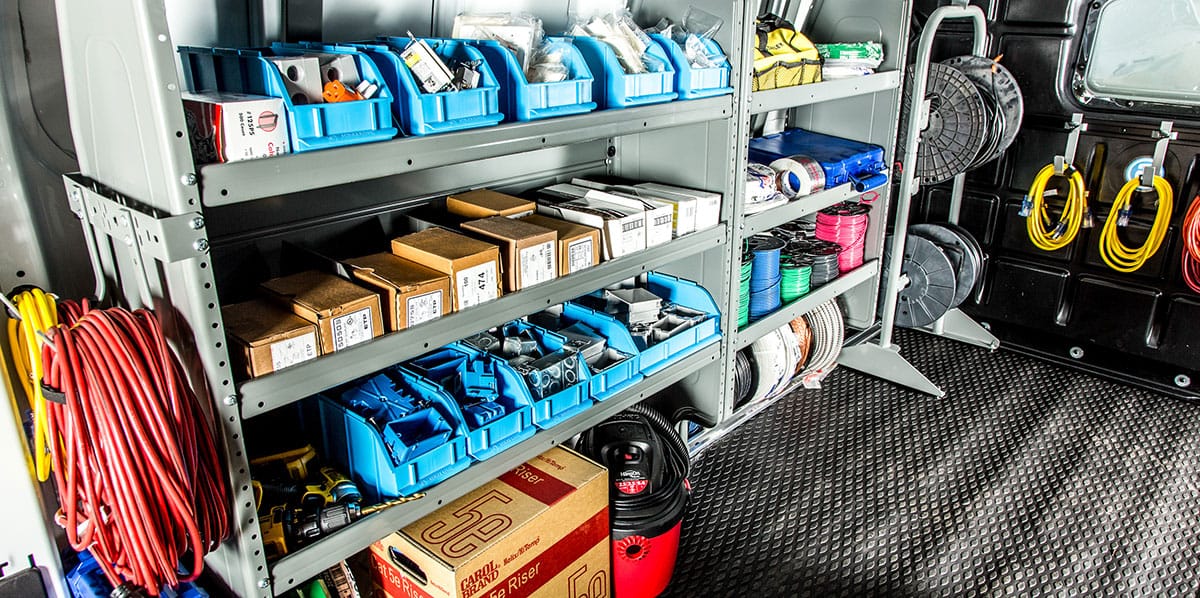
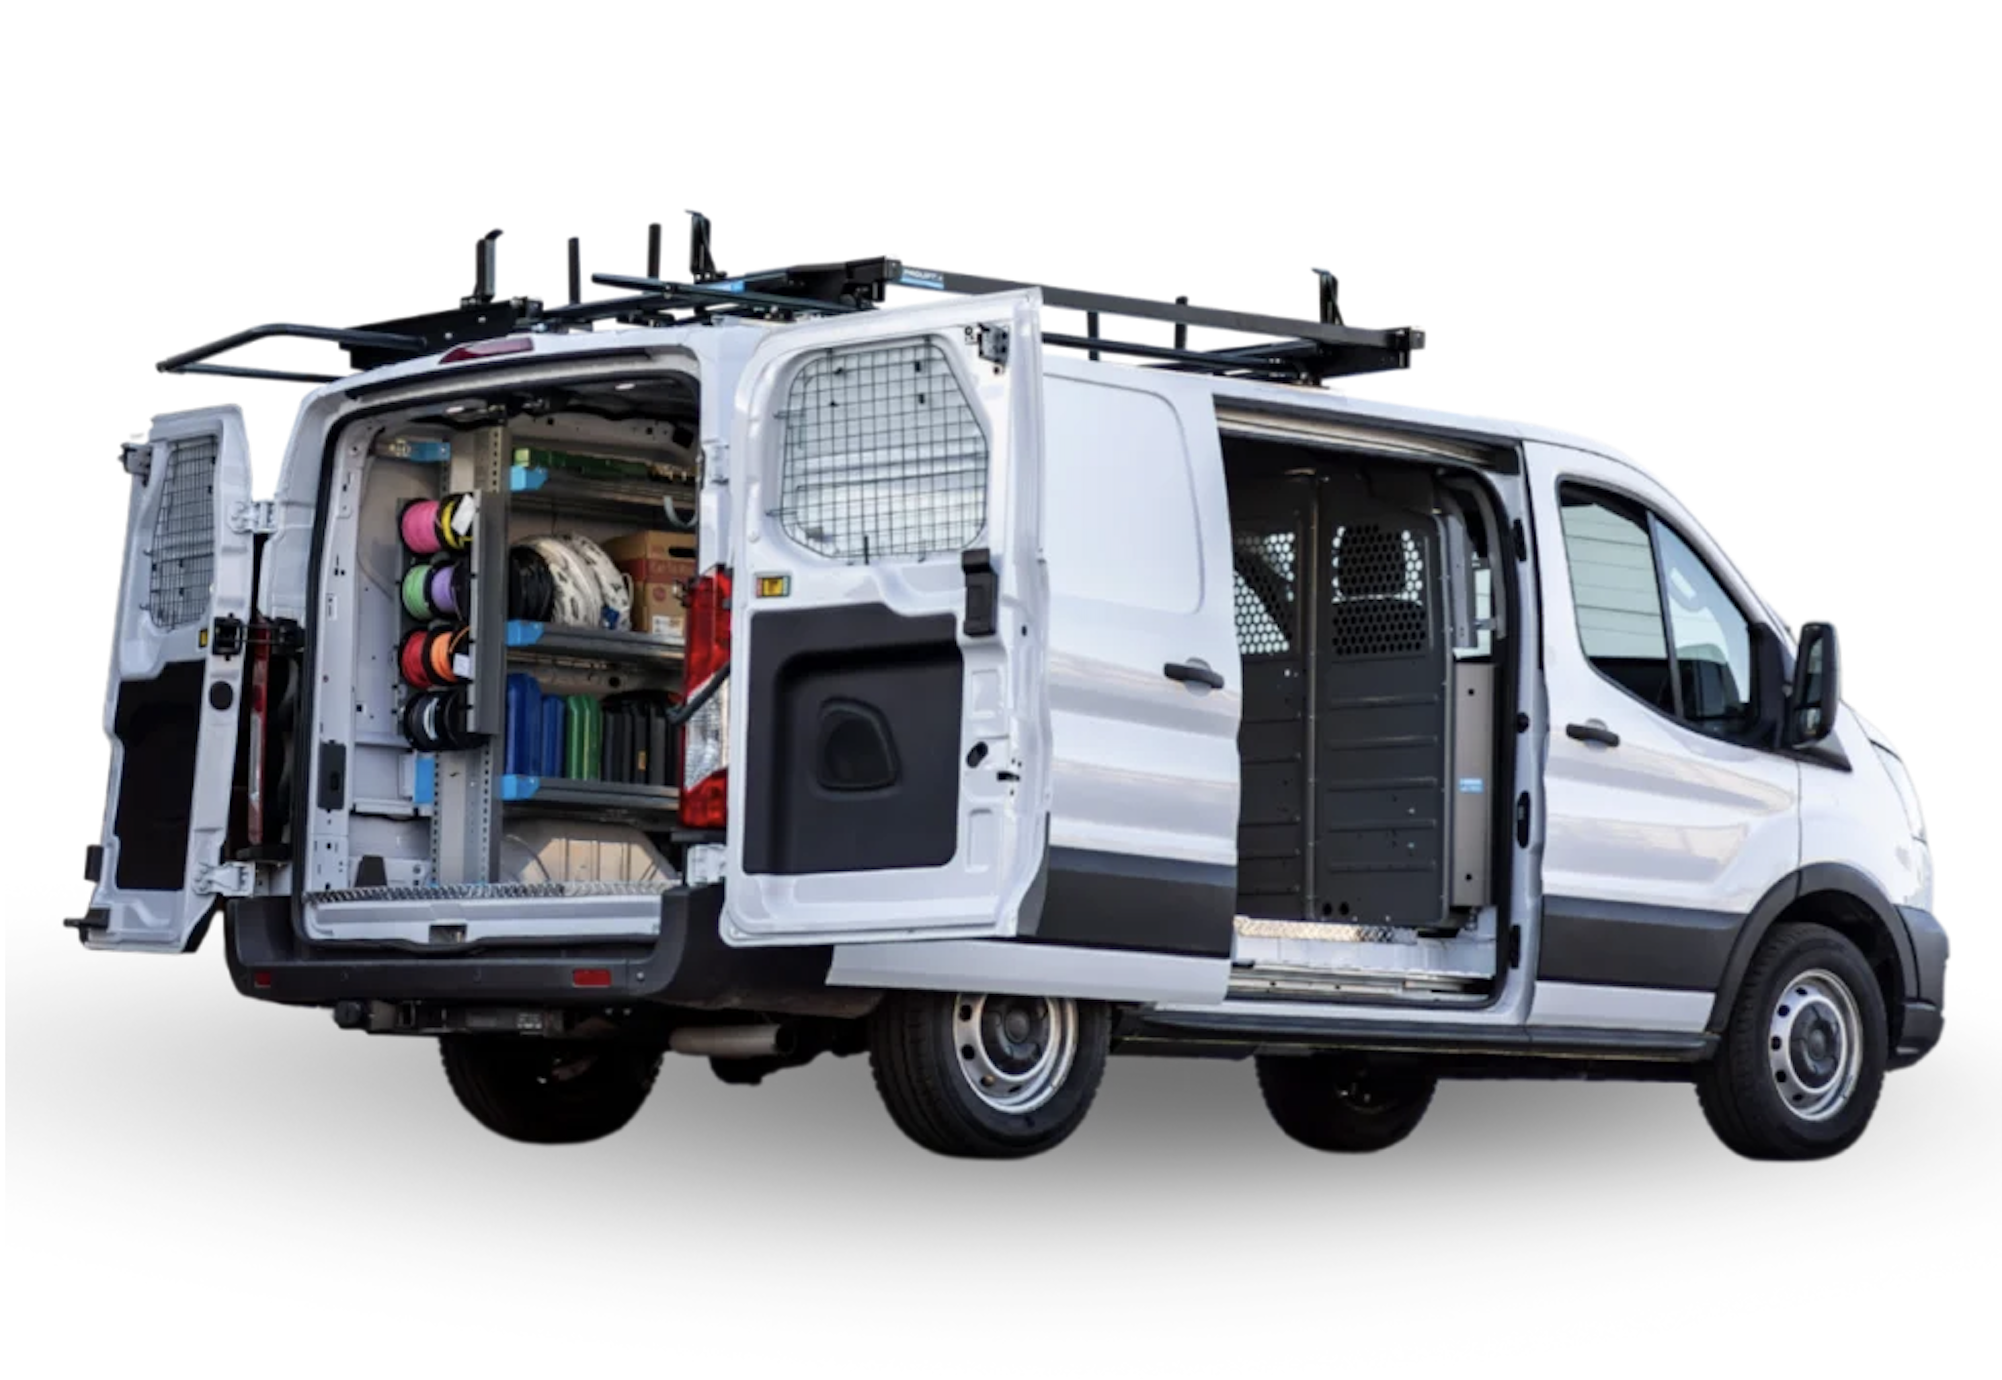
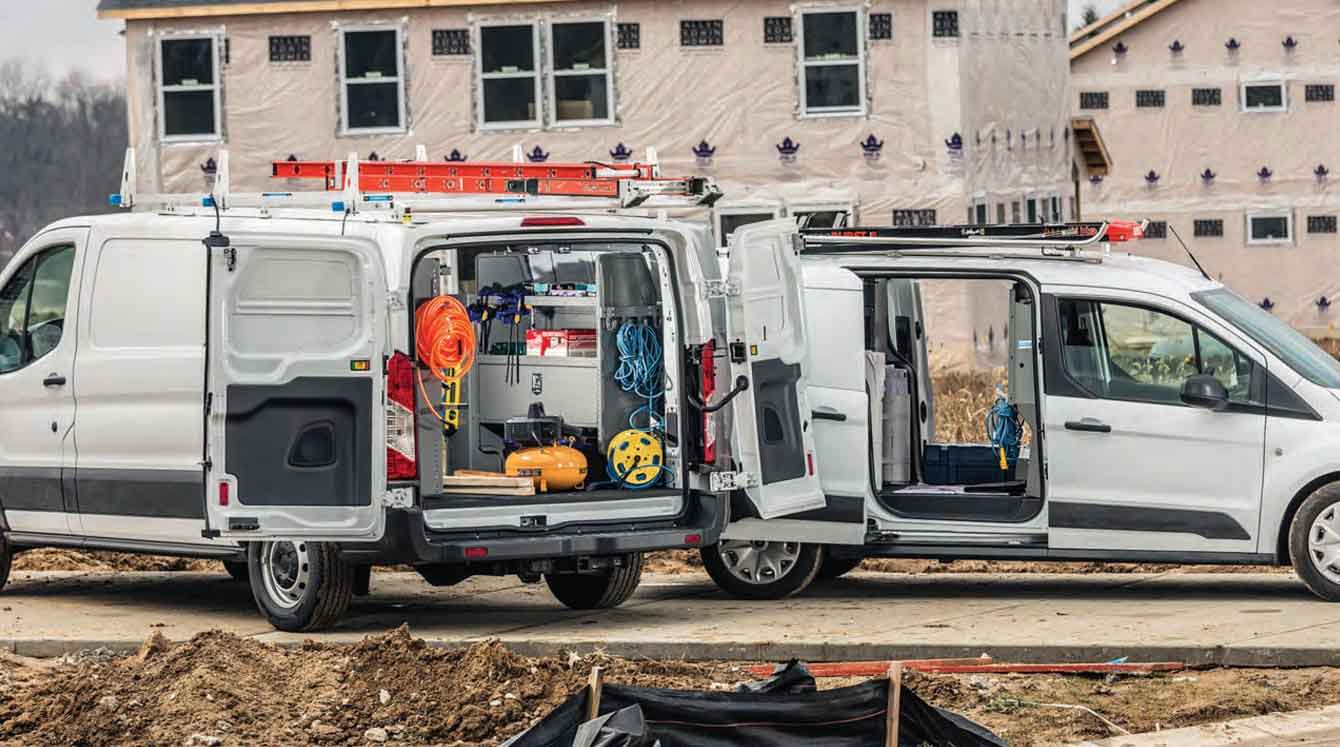
Field and upfit imagery used across dealer materials and post-launch campaign work. Photos courtesy of Nissan Commercial and partner upfitters.
Tough Love.
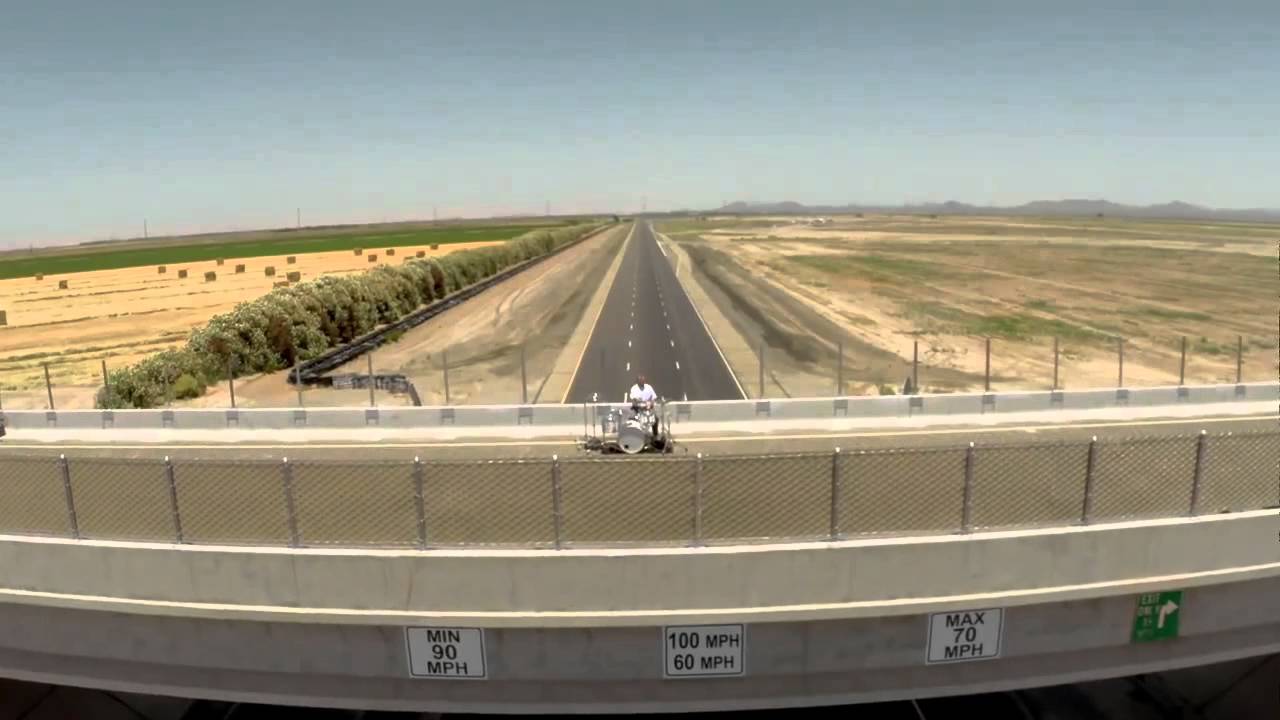
Alongside the Visualizer, we developed a campaign video built around a single word: tough. The NCV is built tough, but it's also built for the work that tradespeople love. That tension gave the campaign its name and its tone.
What I took away.
B2B work rewards research that lives close to the floor. The interesting stuff never showed up in survey data. It showed up in the way a buyer flipped through spec sheets at a dealer, or in the argument two partners had over which van to spec. Pinning interface decisions back to those moments is what made the tool actually useful instead of just pretty.
Buyers walked into the dealership more sure of themselves, and the sales side got a tighter handoff. I'll take that.
What's next.
- Personalization: save-and-return across devices, so a buyer can pick up where they left off
- Mobile: a configurator built for the phone first, since these buyers are rarely at a desk
- Dealer access: let reps view and edit a customer's configuration to speed up the quote
- Better analytics: hover time, abandonment patterns, and other signals to point future UX work
- Loyalty integration: tying Visualizer outputs into Nissan's fleet loyalty and incentives programs
- Standing research rhythm: quarterly testing with fleet buyers and upfitters